
Case Study · Turnaround
Carvana’s Resurgence
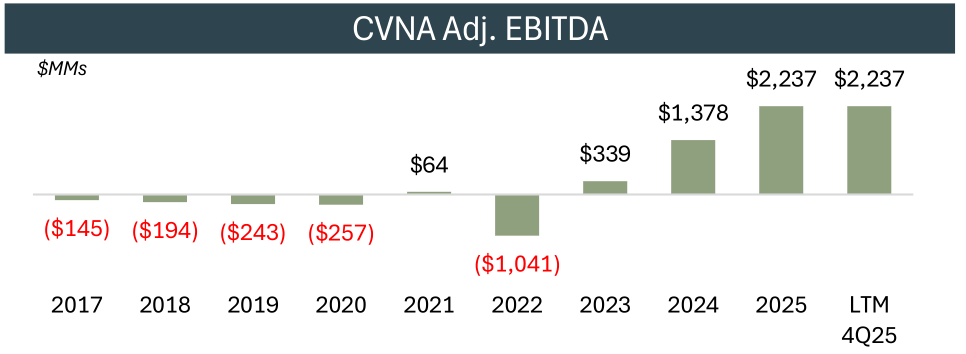
Carvana’s Turnaround from a $1bn Adj. EBITDA Loss to $2.2bn of Adj. EBITDA
4Q 2025
- 4Q25 results were one of the best quarterly results in company history in terms of scale and volume
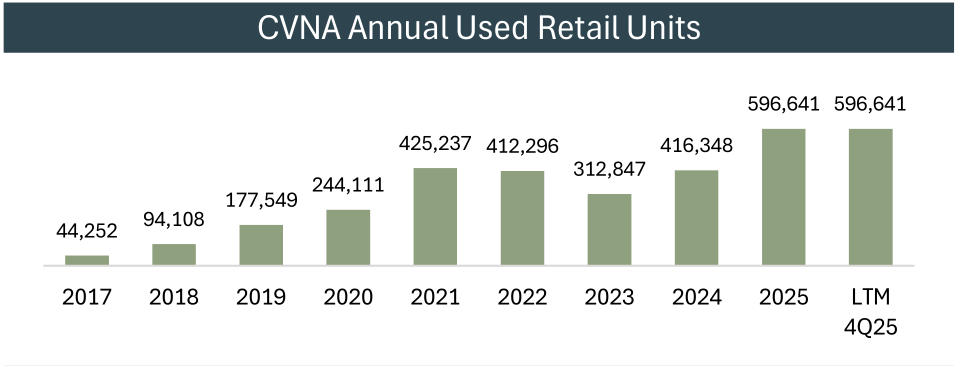
- Used retail unit sales of 163,522 (+43% YoY)
- Revenue of $5.6bn (+58% YoY)
- Adj. EBITDA of $511mm (+42.3% YoY) and Adj. EBITDA margin of 9.1%
- CVNA’s 2025 results show sequential increases in retail units and an increase in Adj. EBITDA for new quarterly and annual records
- Update on Management Objective:
- CVNA reaffirmed that it is on the path toward its goal of “selling 3mm retail units per year at a 13.5% Adj. EBITDA margin within 5 to 10 years”
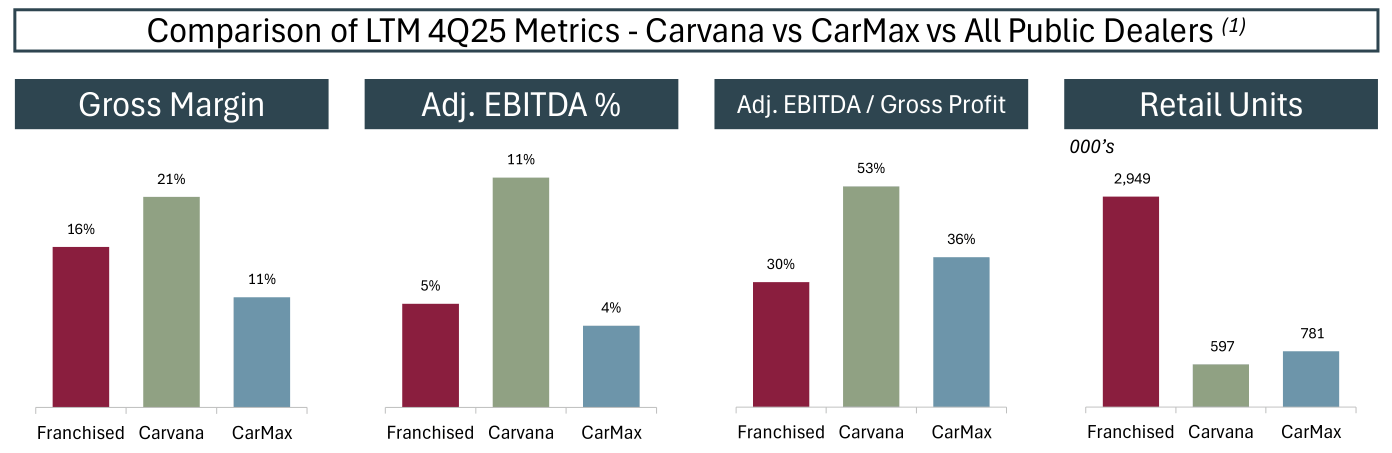
- With a market cap ~2.1x larger than all the franchised dealers combined and 8.8x KMX, equity investors are “all-in” with CVNA’s expectations that it can expand margins while growing its unit sales 5x
Source: Company filings
(1) Public Dealers includes the combined totals of ABG, ACQ, AN, GPI, LAD, KMX, PAG and SAH. Financial data as of 4Q25 and market cap as of 9/30/26
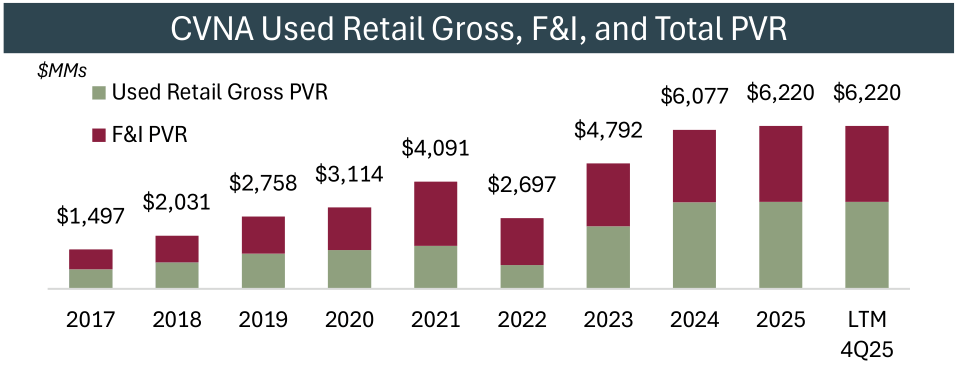
“Worst to First” - Carvana is now the Most Profitable of all Public Dealers and by Far the Most Valuable
Commentary on CVNA’s Valuation
- Why is CVNA’s market cap 2.1x and 1.7x larger than that of the franchised and public dealers, respectively?
- CVNA is a high-profile, e-commerce “tech stock” that is covered by Technology (not auto) equity research analysts
- CVNA’s avg daily trading volume is >3m shares, while the franchised dealers average <300k shares
- AMassive organic growth potential selling DTC in a large, highly-fragmented market, while growth for franchised dealers is largely limited to capital-intensive acquisitions
- B“Asset-lite” business model that requires limited capex and minimal facility overhead
- What are investors overlooking about CVNA and franchised dealers that creates such a valuation gap?
- CVNA is entirely exposed to the conditions in the used market
- Adverse conditions in the securitization market could freeze Carvana’s ability to unload consumer vehicle loans it made
- Dealers take low / no risk to generate F&I income
- CVNA is precariously dependent on Ally for floorplan lending and as a buyer for its auto finance receivables
- Dealers have assets besides cars to pledge as collateral for lenders, as well as support from captives
- Governance - the Garcias hold >80% voting rights
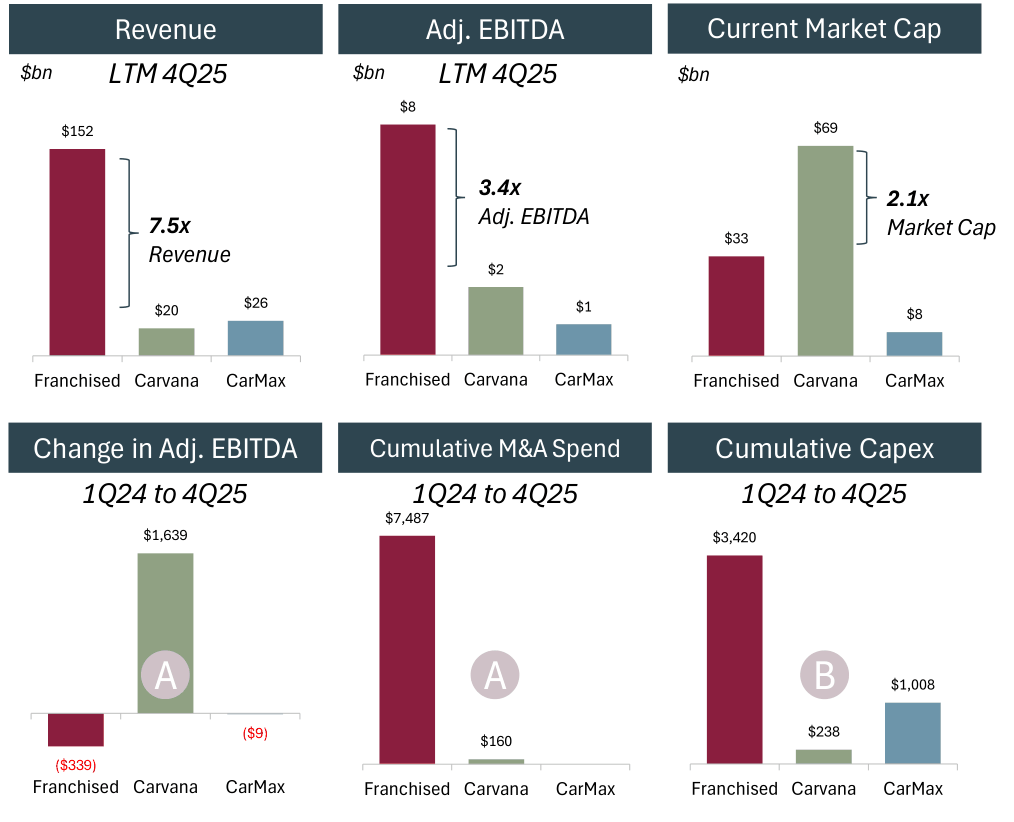
- ASince 1Q24, U.S. public franchised dealers spent $7.5bn on M&A and $3.4bn on capex ($10.9bn total), while LTM Adj. EBITDA declined ~$339mm
- AConversely, since 1Q24, CVNA spent $398mm on M&A and capex, while its LTM Adj. EBITDA increased by $1.6bn to $2.2bn
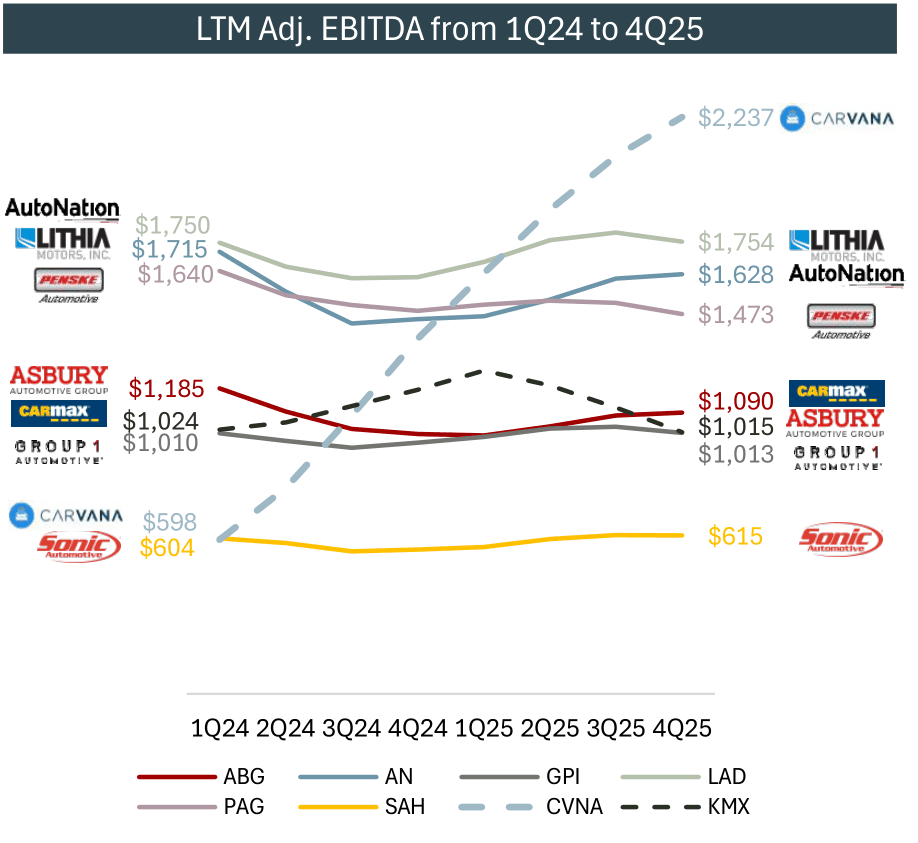
- CVNA management set a high bar for its future performance
- Any unusual selling of stock by the Garcias would be a sign that the bar may be too high
Case studies are prepared by Trackhawk Advisors from the sources cited on each page. They are for information only and are not investment advice or a recommendation to buy or sell any security.
More Case Studies
Copart's Acquisition of ACV AuctionsCarvana Taps Institutional Loan Market to Repay BondsBlue Compass RV Refinances Its Term Loan BGee Automotive’s Acquisition of Tuttle-Click and Jim ClickAmerica’s Car-Mart Refinanced Credit FacilityLithia Taps the Bond MarketHudson Upsizes Notes Offering to Refinance DebtGlobal Auto Refinances Lookers Acquisition DebtMorgan Add-on Funds South Motors Acquisition